Analyzing for memory leaks in Java involves identifying objects that are no longer being used by the program but are still being held in memory. which can cause memory usage to increase over time and potentially lead to out-of-memory errors. Here are the steps for analyzing and identifying memory leaks in Java:
Identify the symptoms:
The first step in analyzing for memory leaks is to identify the symptoms of the issue, such as out-of-memory errors or increasing memory usage over time.
Gather data:
Once the symptoms have been identified, gather data on the application’s memory usage. This can be done using tools such as Java’s built-in JMX monitoring, VisualVM or JConsole. JFR is another tool to get events and data that is occuring in the jvm. Java Mission Control provides these data. There are some other tools in this page mentioned below
https://docs.oracle.com/javase/9/troubleshoot/diagnostic-tools.htm#JSTGD117
Create heap dumps:
At first lets learn what is heap dump.
Heap dumps :
The term Heapdump describes the JVM mechanism that generates a dump of all the live objects that are on the Java™ heap, which are being used by the running Java application. There are two dump formats, the text or classic heap dump format and the Portable Heap Dump (PHD) format.
Create heap dumps at regular intervals or when the application experiences an out-of-memory error. Heap dumps can be analyzed using tools like Eclipse Memory Analyzer (MAT) or VisualVM.
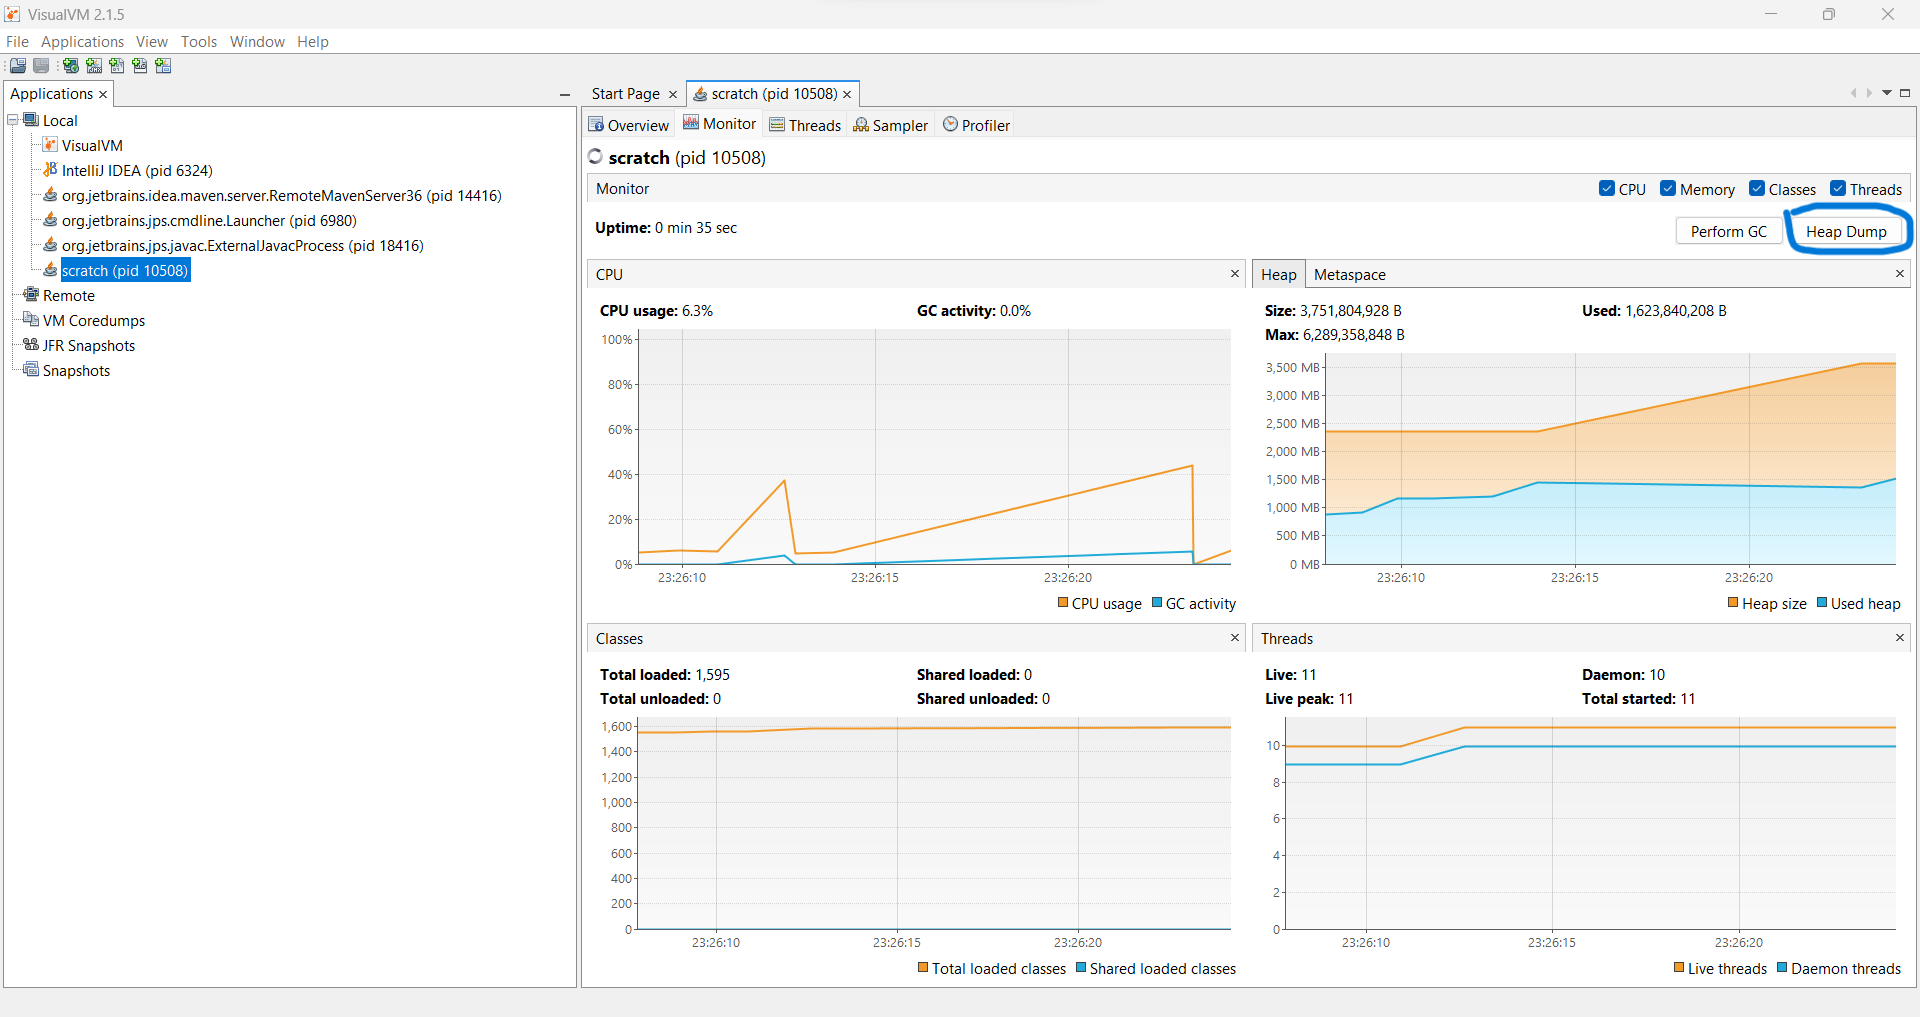
Fig 1: VisualVM
Analyze heap dumps
Analyze the heap dumps to identify the objects that are being held in memory but are no longer being used by the application. MAT and VisualVM can help identify the root cause of memory leaks. Below is the snap for MAT where a heap dump file is loaded
Java heap dumps can be analyzed using various tools, such as Eclipse Memory Analyzer (MAT) and VisualVM.

Fig 2: Eclipse MAT
Here are the general steps for analyzing Java heap dumps:
- Capture the heap dump: Heap dumps can be captured using command-line tools like jmap or via the application itself (if it supports such functionality). Heap dumps can also be automatically captured when the application experiences an OutOfMemoryError.
- Load the heap dump into the analysis tool: After capturing the heap dump, load it into an analysis tool like Eclipse Memory Analyzer (MAT) or VisualVM. Both tools have built-in heap dump analysis capabilities.
- Analyze the heap dump: Use the analysis tool to explore the heap dump and identify potential memory leaks. The analysis tool will provide information about the objects in the heap, their sizes, and the relationships between them.
- Identify the root cause: Use the analysis tool to identify the root cause of the memory leak. This may involve identifying objects that are not being garbage collected, objects that are unnecessarily retained in memory, or objects that are being excessively created.
- Take action: Once the root cause has been identified, take action to address the issue. This may involve modifying the code to properly release resources, updating third-party libraries, or tuning the JVM settings to better manage memory.
- Verify the fix: After making the necessary changes, verify that the memory leak has been fixed and the application is functioning correctly.
Overall, analyzing Java heap dumps requires a deep understanding of the application’s memory usage patterns and the tools used for heap dump analysis. By following these general steps, developers can identify and address memory leaks in their Java applications.
Identify the cause:
Once the objects causing the memory leaks have been identified, determine the root cause of the issue. This may involve reviewing the code to identify incorrect memory management practices or third-party libraries causing the issue.
Fix the issue:
Fix the issue by correcting the root cause. This may involve modifying the code to properly release resources, updating third-party libraries, or tuning the JVM settings to better manage memory.
Test:
Test the application to ensure that the memory leak has been fixed and that the application is functioning correctly.
By following these steps, developers can identify and address memory leaks in their Java applications. Regular monitoring and analysis can help prevent memory leaks from becoming a significant issue in production environments.
Analyze for finding Memory leaks
In order analyze whether your program contains any potential Memory Leaks you will need some kind specialized tools like
- HeapHero
- JProfiler
- VisualVM
these allow you view what exactly happening under hood during runtime & identify problematic areas ahead time before problems start manifesting themselves on production environment.
In the case I was working, we started looking into which classes were taking much memory and thread execution as well. Then exported a heap dump and analyzed it with Eclipse MAT and isolated the class which was an old version of a library.
Steps to prevent Memory leaks
To prevent Memory Leaks occurring its important ensure all resources get closed properly at end each operation ; try avoid creating too many temporary variables unnecessarily & keep track object lifetime create them only necessary basis then dispose off quickly once done with it ; finally make sure Garbage Collector running correctly so old unused objects get cleared up regularly thus freeing up valuable system resources