What is OutOfMemory
java.lang.OutOfMemoryError exception is thrown when there is insufficient space to allocate an object in the Java heap. In this case, The garbage collector cannot make space available to accommodate a new object, and the heap cannot be expanded further. Also, this error may be thrown when there is insufficient native memory to support the loading of a Java class. In a rare instance, a java.lang.OutOfMemoryError may be thrown when an excessive amount of time is being spent doing garbage collection and little memory is being freed.
When a java.lang.OutOfMemoryError exception is thrown, a stack trace is also printed. In that stack trace the cause are mentioned for easier fixing of the issue.
This exception will be thrown when
- Memory Leak occurs
Not enough heapspace to allocate objects- If
GCis running all the time - Trying to allocate memory larger than the heap size
- When Metaspace memory is full
- When native memory is not enough to allocate
How OOM happens
There are many more reasons OOM can occur. An OutOfMemoryError (OOME) is bad. It can happen at any time, with any thread. There is little that you can do about it, except to exit the program, change the -Xmx value, and restart the JVM. If you then make the -Xmx value too large, you slow down your application. The secret is to make the maximum heap value the right size, neither too small, nor too big. OOME can happen with any thread, and when it does, that thread typically stops. Often, there is not enough memory to build up a stack trace for the OOME, so you cannot even determine where it occurred, or why.
Now lets dive into the alert system code.
| |
Let us define a Listener which will listen for the alert. Then
| |
In our OOMAlterService we add listeners to implement the OOMAlertService.Listener interface, with one method alertMemoryLow(long used, long max) that will be called when the threshold is reached.
Once we have downcast the MemoryMXBean to a NotificationEmitter we can add a NotificationListener to the MemoryMXBean. You should verify that the notification is of type MEMORY_THRESHOLD_EXCEEDED.
This notification will be emitted fast.Something to note is that the listener is being called by a special thread, called the Low Memory Detector thread, that is part of the standard JVM.
What is the threshold? And which of the many pools should we monitor? The only sensible pool to monitor is the Tenured Generation (Old Space). When you set the size of the memory with -Xmx256m, you are setting the maximum memory to be used in the Tenured Generation. Searching in findTenuredGenPool() method, and returning the first one that was of type HEAP to get the Tenured gen memory.
In setUsageThreshold(doublethreshold) method, I specify when I would like to be notified. This threshold is a global setting. so only one usage threshold per Java Virtual Machine. The threshold value is used to calculate the usage threshold, based on the maximum memory size of the Tenured Generation pool (not the Runtime.getRuntime().maxMemory() value!).
In findTenuredGenPool() I am trying to find the Tenured / Old gen memory which is a heap memory. At first lets understand about JVM Heap and Non Heap memory.
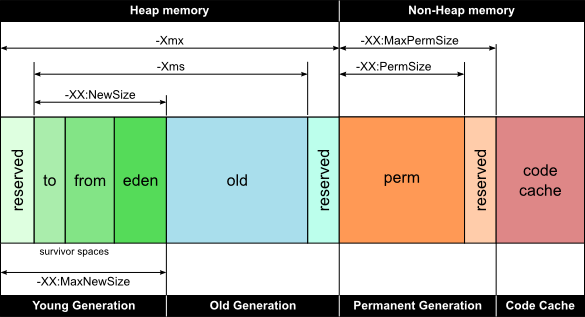
Heap memory
The heap memory is the runtime data area from which the Java VM allocates memory for all class instances and arrays. The heap may be of a fixed or variable size. The garbage collector is an automatic memory management system that reclaims heap memory for objects.
- Eden Space: The pool from which memory is initially allocated for most objects.
- Survivor Space: The pool containing objects that have survived the garbage collection of the Eden space.
- Tenured Generation or Old Gen: The pool containing objects that have existed for some time in the survivor space.
Non-heap memory
Non-heap memory includes a method area shared among all threads and memory required for the internal processing or optimization for the Java VM. It stores per-class structures such as a runtime constant pool, field and method data, and the code for methods and constructors. The method area is logically part of the heap but, depending on the implementation, a Java VM may not garbage collect or compact it. Like the heap memory, the method area may be of a fixed or variable size. The memory for the method area does not need to be contiguous.
- Permanent Generation: The pool containing all the reflective data of the virtual machine itself, such as class and method objects. With Java VMs that use class data sharing, this generation is divided into read-only and read-write areas.
- Code Cache: The HotSpot Java VM also includes a code cache, containing memory that is used for compilation and storage of native code.

And for the application, the below diagram will give you an idea about how memory is distributed.

so now lets go back to the method findTenuredGenPool().
| |
in this method we are looking for a pool which is of type HEAP and also in its name contains the word old. This is one way we can find the Tenured gen pool.
So using this pools size and its threshold we can make alert service that will give us alert when memory is low. That way we can take necessary steps to prevent OOM error.
So now running this service
| |
Here I am just creating a list of object infinitely to induce OOM.