What is JMX
The Java Management Extensions (JMX) API is a standard for managing and monitoring applications and services.
It defines -
- management architecture
- design patterns
- APIs
- services
for building web-based, distributed, dynamic, and modular solutions to manage Java-enabled resources. The JMX APIs make it possible to add manageability to Java-enabled applications, from web phones to set-top boxes to network devices and servers.
The JVM gives you a set of MBeans through which you can access runtime data like memory consumption, GC stats and some more data. You can also invoke many operations. Your app server will also give you many MBeans which you can use to control the server and installed applications.
JMX overview
The JMX technology is native to the Java programming language.
The java.lang.management package provides the interface for monitoring and managing the JVM.
The API provides access to information such as:
- Number of classes loaded and threads running
- Virtual machine uptime, system properties, and JVM input arguments
- Thread state, thread contention statistics, and stack trace of live threads
- Memory consumption
- Garbage collection statistics
- Low memory detection
- On-demand deadlock detection
- Operating system information
The API includes logging monitoring and management capabilities. The java.util.logging.LoggingMXBean interface provides for management of the logging facility.
As a result, it offers natural, efficient, and lightweight management extensions to Java-based apps. It consists of a set of specifications and development tools for managing Java environments and developing state-of-the-art management solutions for applications and services. It provides Java developers with the means to instrumet Java code, create smart Java agents, implement distributed management middleware and managers, and integrate these solutions into existing management and monitoring systems (eg. APM)
The dynamics of the JMX technology architecture enables you to use it to monitor and manage resources as they are implemented and installed. It can also be used to monitor and manage the jvm
JMX’s layerd architecture
JMX technology provides a tiered architecture where managed resources and management applications can be integrated in the plug-and-play approach as shown in below image . A given resource is instrumented by one or more Java objects known as Managed Beans (or MBeans), which are registered in a core managed object server known as the MBean server. This server acts as a management agent and can run on most Java-enabled devices.

So in this part the topic of discussion will be the Manager Level. But before going into it let’s get a overview of all the levels
| Level | Description |
|---|---|
| Instrumentation | Resources, such as applications, devices, or services, are instrumented using Java objects called Managed Beans (MBeans). MBeans expose their management interfaces, composed of attributes and operations, through a JMX agent for remote management and monitoring. |
| Agent | The main component of a JMX agent is the MBean server. This is a core managed object server in which MBeans are registered. A JMX agent also includes a set of services for handling MBeans. The JMX agent directly controls resources and makes them available to remote management agents. |
| Manager | Protocol adaptors and standard connectors make a JMX agent accessible from remote management applications outside the agent’s Java Virtual Machine (JVM). |
Manager level:
JMX API instrumentation can be accessed through existing management protocols. For example Simple Network Management Protocol (SNMP). Another way is through proprietary protocols. The MBean server relies on protocol adaptors and connectors to make a JMX agent accessible from management applications outside the agent’s JVM.

Each adaptor provides a view through a specific protocol of all MBeans registered in the MBean server. For example, an HTML adaptor could display an MBean in a browser.
Connectors provide a manager-side interface that handles the communication between the manager and the JMX agent. Each connector provides the same remote management interface though a different protocol. When a remote management application uses this interface, it can connect to a JMX agent transparently through the network, regardless of the protocol.
A graphical JMX monitoring tool, jconsole, enables us to monitor the performance of a JVM and instrumented applications, providing information to help you optimize performance.
Now we are going to explore one of the connectors which will be used by VisualVM which is different from Jconsole. JConsole uses only JMX, but VisualVM uses other monitoring technologies like Jvmstat, Attach API and SA in addition to JMX. It can merge data from all those monitoring technologies in one place and the user does not need to think which technology he should use in particular situation.
VisualVM helps to get lot of information out about the JVM and how it’s performing. But we will only look into the jmx connection in VisualVM
Setup VisualVM with JMX :
After downloading VisualVM when starting it will look for all the local JVM instances. Remote connections need to be added by specifying host and jmx port which needs to be setup while running the application as system property.
| |
this configuration is for non-production use case as the port is open withou any SSL security. Here the jmx port will be 9875 and then we will need to connect to this port from visualvm. This port is by default given.
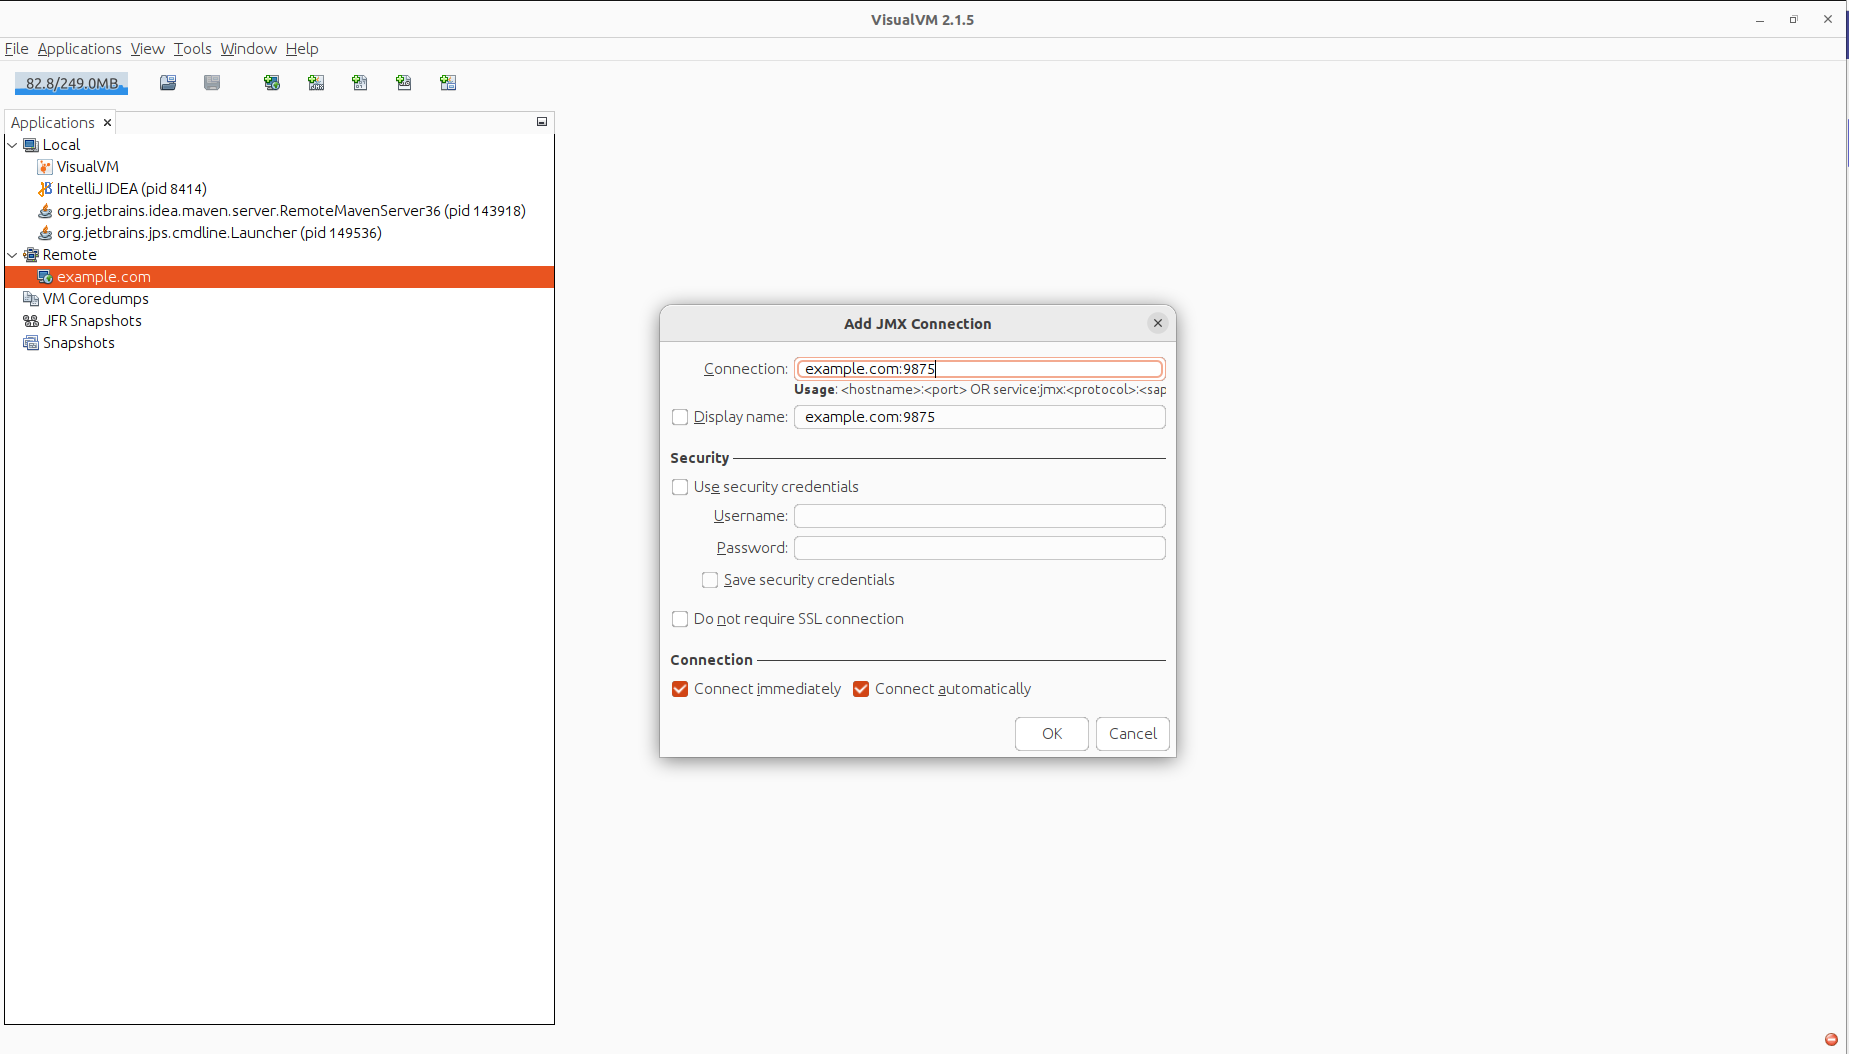
now after connecting with jmx port in visualvm we will get to see something like this
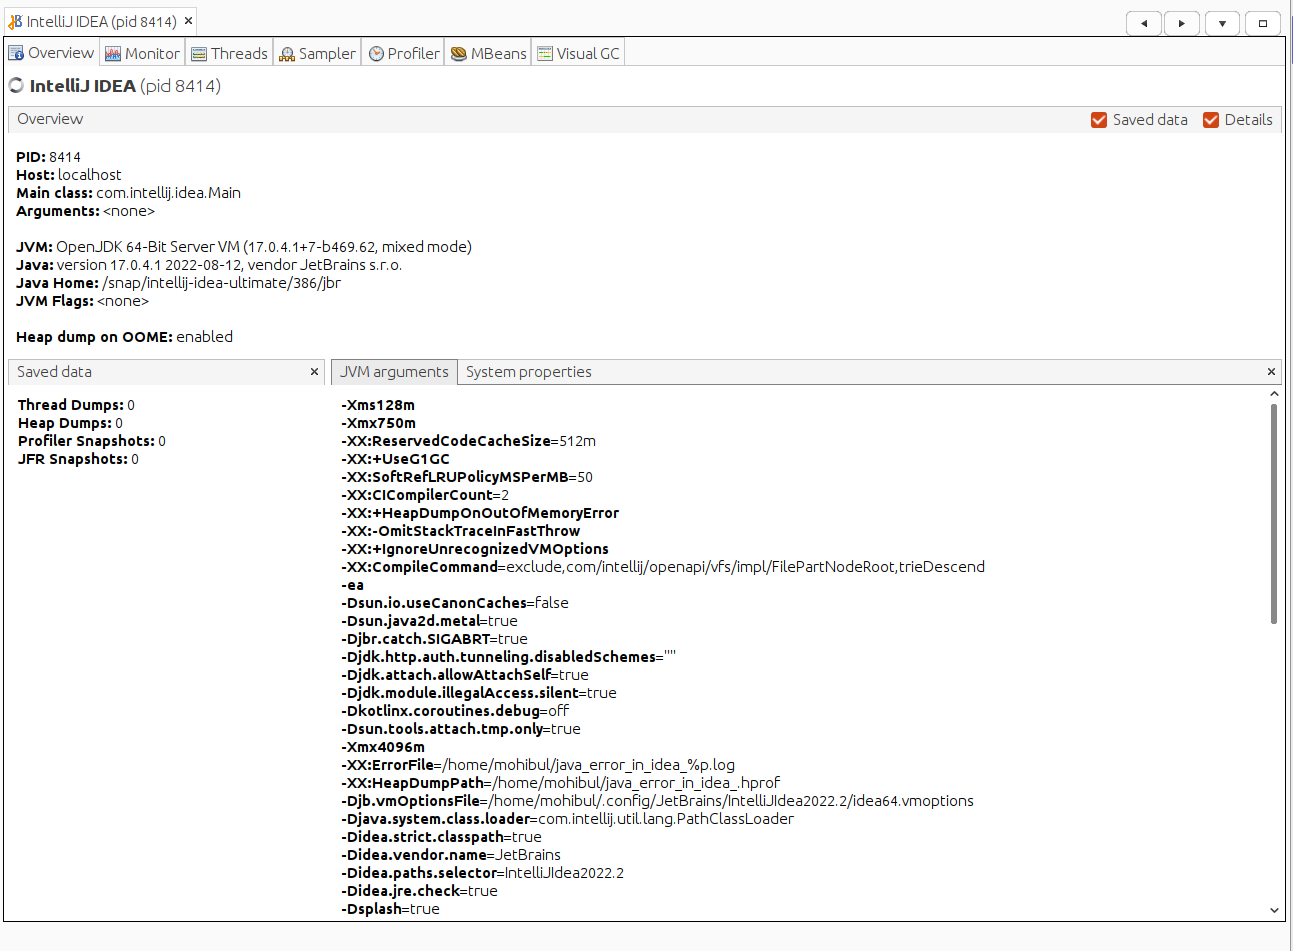
where there is tabs like monitor ,threads, sampler, profiler and many more extensions. By using these we can monitor
- Cpu Usage
- Heap Size
- Threads and states of them
- Sample CPU and Memory usage
- Profiling
- Check Platform and Custom MBeans for JVM and applications
- VisualGC which helps to visualize GC
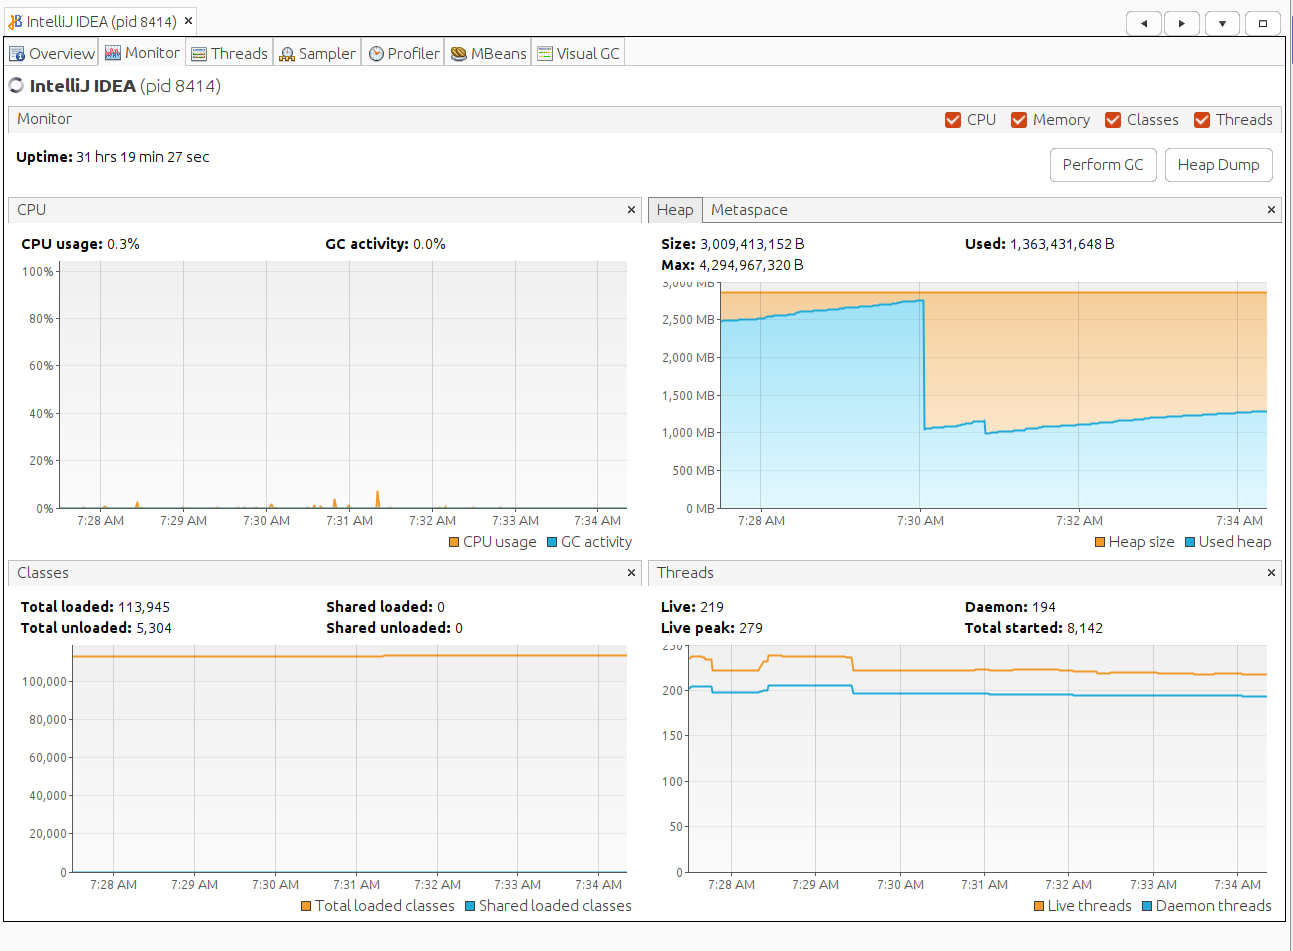
here we can see the memory and cpu usage of intellij IDE.
In the next part will try to discuss about the Agent level of JMX